

Summary
- While building Assembled Brands and Weekly Accounting, we have seen the financials from over 3,000 Shopify businesses in the last 8 years and invested in over 120 of them.
- This article summarizes our learnings and shares how we look at these businesses.
- Our intention is to help ECommerce company founders see their business better and help them optimize the balance between growth and profitability – and then help to finance their inventory as they grow.
Background
Assembled Brands (AB) is a $100m fund that lends money against the inventory of emerging consumer brands. Inventory financing was not available to brands in when Adam Pritzker and I began developing the business in 2016.
To start the business we offered a gift. We reached out to hundreds of brands and offered to build them an Integrated Financial Model and a consultation with an experienced CFO. We built 150 of these models and met with 150 founders.
From that data we identified the handful of key metrics that became our investment criteria. For a debt fund like AB, this criteria is called the “credit box.” A credit box is the collection of metrics that a lender is generally willing to fund on. Think of it like your FICO score and debt to income ratio that banks use to qualify a home buyer for a mortgage.
What we learned
We proved that the handful of key metrics that we identified for our credit box were a great way to predict the success of emerging consumer brands. We’ll show you those key metrics below.
In addition to proving the key metrics, we also observed:
- More than half had fluctuating gross margins indicating poor balance sheet accounting;
- Few were doing proper revenue recognition;
- Less than 15% had great inventory forecast models;
- Less than 5% really understood their unit economics properly;
All of this indicated that small businesses are woefully underserved by their outsourced finance and accounting teams. This was not surprising to us because we believe that A CPA is a license to do your books in a way that doesn’t help the business. 🙂
Though I remain on the board and credit committee of Assembled Brands, I left my day-to-day responsibilities at Brands in 2020 because we saw an opportunity to build a platform that could help small business in general, and ECommerce brands in particular, see and manage their business better. It’s a big opportunity: both Quickbooks Online and Shopify have around 5 million users.[Sources]
Introducing Weekly Accounting
We built the Weekly Accounting System to do this at scale. The system automates the things that people expect from a great CFO including:
- Instrumenting the Revenue Engine;
- Analyzing trends in their Unit Economics; and
- Forecasting inventory, profitability and cash flow.
We built it to be simple to use.
Just connect your apps to the Weekly Accounting System and it will produce
- Monday Morning Metrics: The perfect weekly view to manage the business, and the
- Integrated Financial Model: The perfect monthly, quarterly and annual view to forecast cash flow, financing requirements and valuation.
Before we dive in to deep, a quick aside.
Weekly Accounting is a language to learn.
“The structure of our language affects our structure of thinking and thus our perception of the world.”
But before there is language…
It Start With An Intention
Traditional Accountants intention is compliance. IRS rules, Accounting rules – neither of which help you run the business.
Weekly Accounting’s intention is to help you see your business better.
To do that we gather data, analyze it and present a map of your business. Like a sonar.
Traditional Accountants tend to ignore data from any system other than the bank. That would be like listening to an orchestra and only hearing when the letter F was played.
I am not an accountant. One of my jobs was Sonar System Engineer.
A sonar gathers data, analyze it and present a map of the territory.
That’s what the Weekly Accounting System does for your business.
The Weekly Accounting System 
In the language of Weekly Accounting, an Income Statement and Balance Sheet are just two of the “Rowsets” of a business.
A Rowset is a collection of related rows of data about a business.
Traditional Income Statement and Balance Sheet Rowsets
A Flow Rowset, like the income statement, shows how much money moved during a particular period of time.
A Balance Rowset, like the balance sheet, shows how much money was sitting in a certain place at a certain time.
Since 1494, when the balance sheet was invented, accountants have never thought to look above the revenue line on the income statement to see what happens. To a traditional accountant It’s as if nothing happens if it didn’t hit your bank account.
But your income statement and your balance sheet aren’t even your most important rowsets.
In the language of Weekly Accounting, the Revenue Engine is the most important rowset in your business.
The Revenue Engine
A Revenue Engine is how a business reaches and sells to its customers and then how it gets paid for and delivers a result.
The Revenue Engine Rowset is like the dashboard on a car – a set of numbers that indicate the performance of the engine and the car on the road. When we “instrument” a revenue engine we are focused on the information necessary for calculating the unit economics.
The sections of a revenue engine in language that works across industries include:
- An audience & a conversion rate
- New customers & Repeat customers
- Unit economics
- A simple cash based P&L.
From this perspective each company in each industry might have slightly different naming conventions, but from a meta-level, when financial modeling and forecasting are important, it’s all the same.
The revenue engine of an ECommerce businesses instruments how the company reaches, converts and delivers its product to its audience as in:
Now that you understand “Rowsets” let’s look at the views that we use them in.
The Views of The Weekly Accounting System
When we implement the Weekly Accounting System at a company, we start by integrating the data from every business application into the Weekly Data Warehouse. From there we transform the data and do the required calculation to present it in the form of an Integrated Financial Model and Monday Morning Metrics. An image of each is below.
Integrated Financial Model View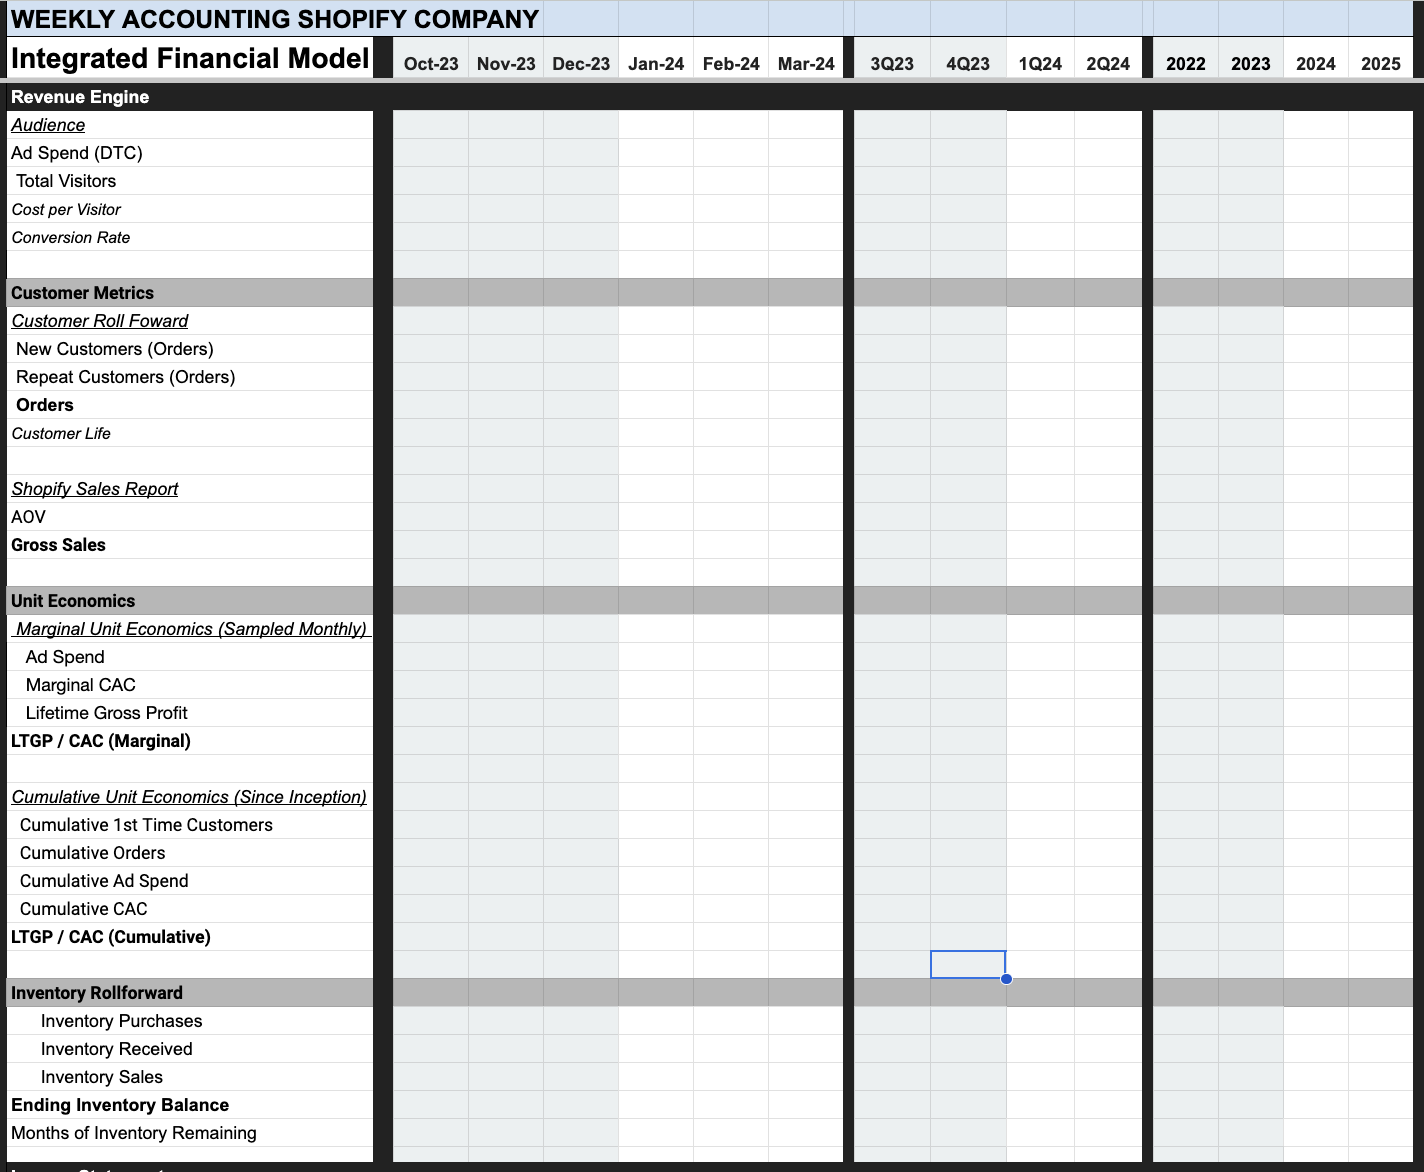
Monday Morning Metrics
Trends in Unit Economics
We have seen many founders talk about their LTV to CAC ratio being 2.4x. When founders say something like that, I say: “Meaningless statistics are up 6.7% today.”
The point in time view of LTV to CAC is meaningless for two reasons:
- Lifetime Value is an ambiguous word. Most people calculate it as Lifetime Revenue. For this reason we use a metrics we call LTGP or Lifetime Gross Profit.
- When presented as a single metric that merely represents a point in time or a period of time. Trends in this ratio have a direct correlation to how big the company can grow.
When analyzing LTGP/CAC, we “sample it” over time. We sample it Weekly, Monthly and Quarterly and Cumulatively.
Looking at LTGP/CAC cumulatively gives us a baseline performance metric for the entire history of the company. Cumulative CAC is calculated by taking all the Ad Spend in the history of the company divided by all new orders from first time customers.
7 Responses
The depth of research and clarity in your writing is truly impressive. I found this article very helpful and will definitely be applying some of these ideas.
Trent – We if you have a Shopify business and you’d like us to do this analysis for you for free you can get started with by connecting you QBO here.
Keep inspiring your audience—you’re making a real difference!
I really appreciate the effort you put into making your content so valuable. This was an excellent read, and I’ve taken away some great points!
Thank you Iyana – let me know if I can help you with anything.
Your blog never disappoints! This piece was especially thought-provoking—it gave me a fresh perspective and plenty of ideas to explore. Thank you for consistently delivering high-quality content!
Thank you!