
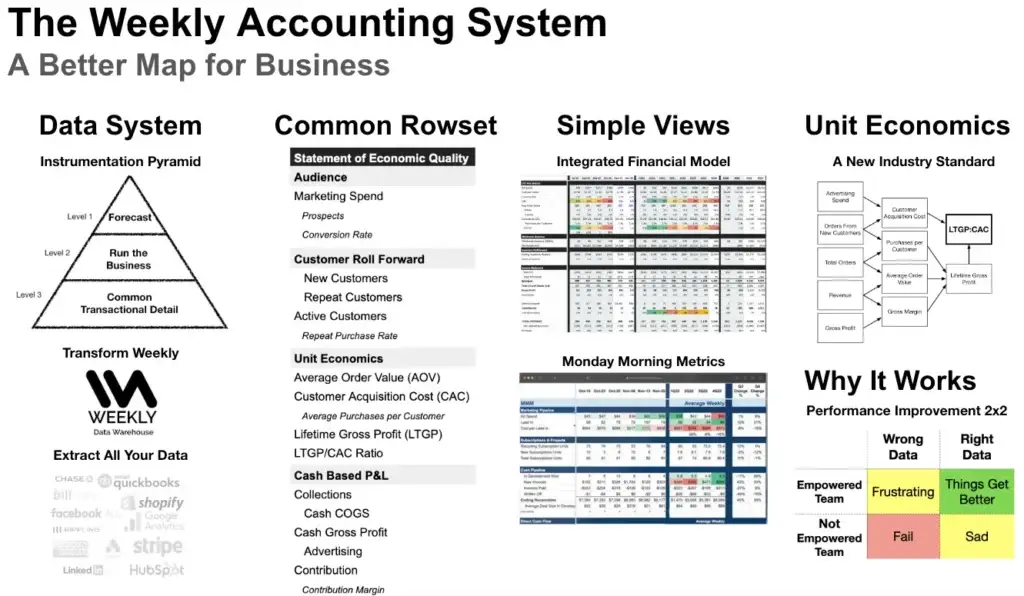
The Weekly Accounting System
We do accounting for all your business data. Traditional accountants are myopic and rear facing.
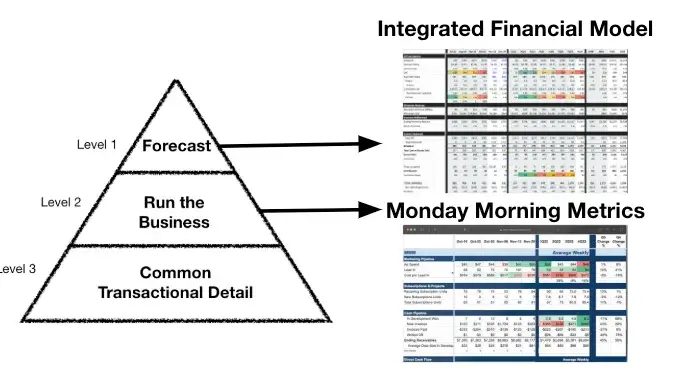
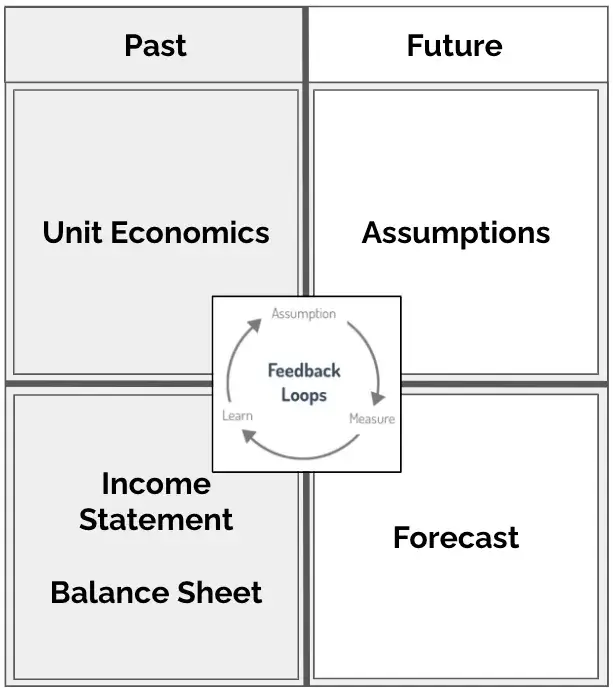
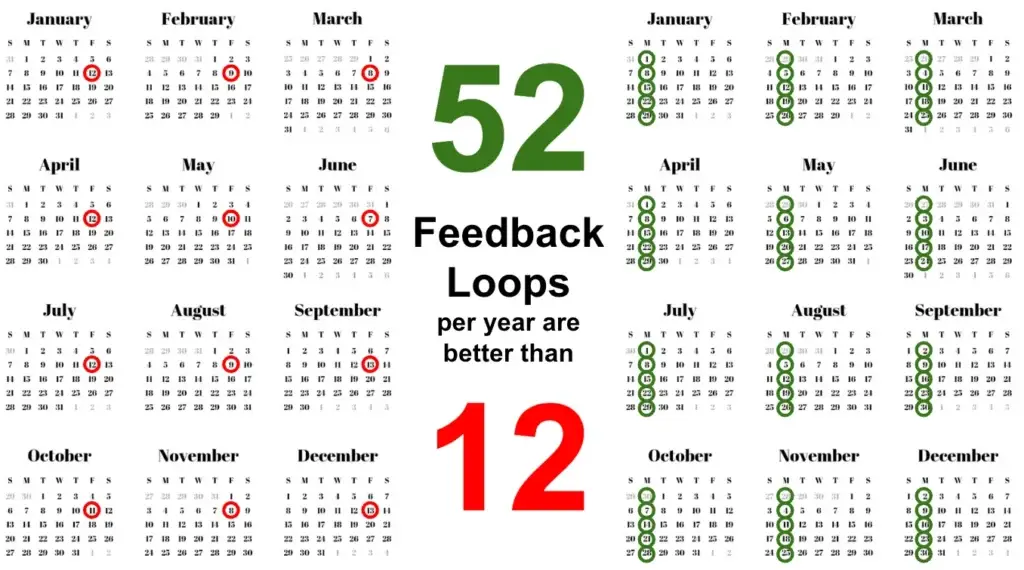
We look at trends weekly, monthly and quarterly to forecast and run the business.
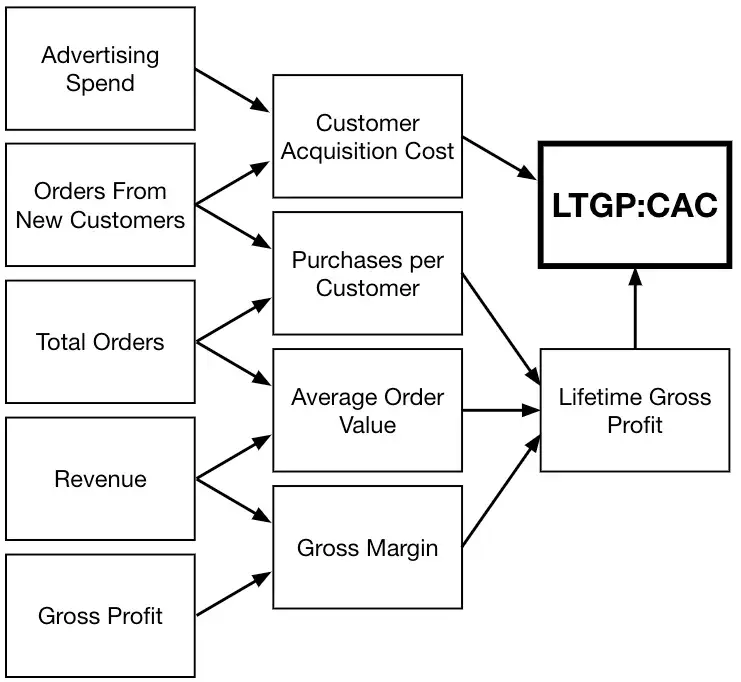
Unit Economics are like the frequency codes of your business.
Our forecasts and weekly views have the same structure.
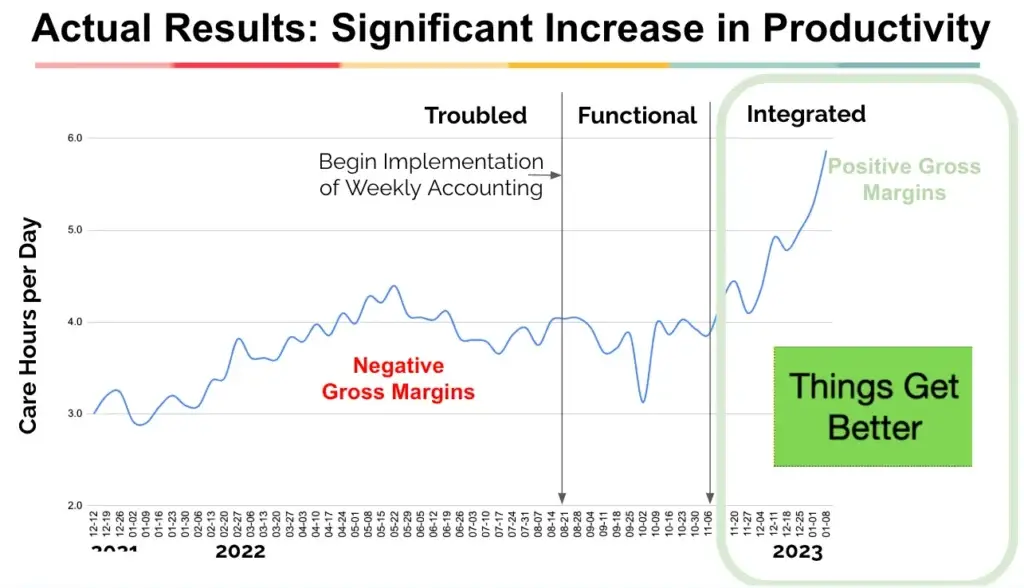
We guide you from Troubled through Functional to Integrated on your path to World Class.
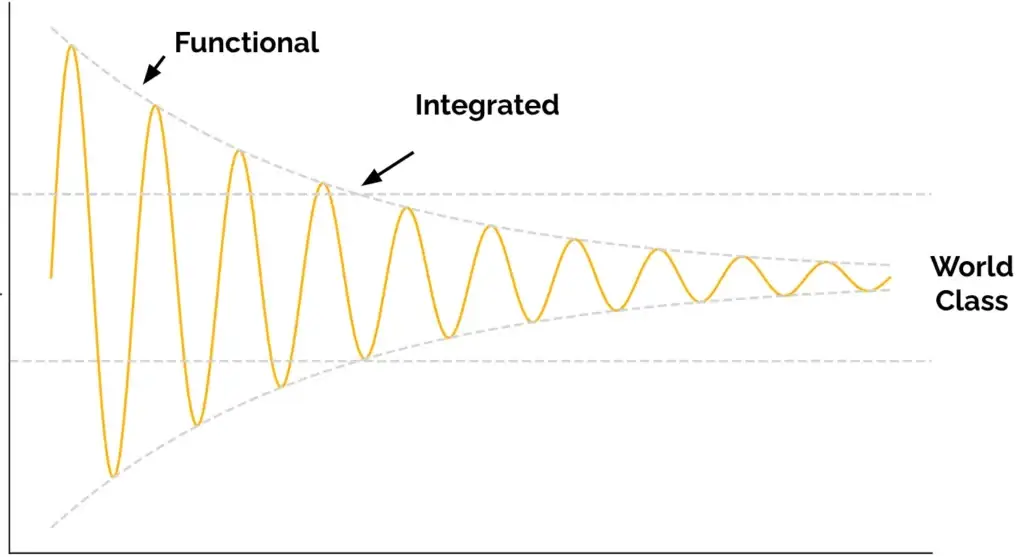
Make more progress faster.
The first time you see your data weekly, you might be confused. People say
Where’d you get that number?
Then, as we start to look at the same numbers defined the same way every week three or four weeks in a row, you move from questioning the numbers to confidence in the numbers.
Then, when you have a few quarters of data and you can see your quarterly data on an average weekly basis, the Signal and the Noise of your business becomes clear.
The chart below shows “Care Hours per Day”, a productivity metric for 100 therapists at a venture-backed provider of mental health services.
Companies spend a lot of time frustrating themselves with the wrong data or disempower themselves from doing anything about it. The Weekly Accounting System breaks them free of that doom loop.

The Weekly Accounting System is a powerful way to see and run your business. In the past you’d have to hire a full time CFO and an expensive data team to build these custom views of your business.
We make it simple for you.
Explore
Weekly Accounting has a particular way it does Unit Economics. This video explains that way.
FAQs
Our technology platform automates data collection and reporting, providing weekly insights instead of monthly reports. This allows our fractional CFOs to focus on strategic guidance rather than manual processes.
Our streamlined four-week onboarding process includes chart of accounts optimization, system integration, custom reporting setup, and team training.
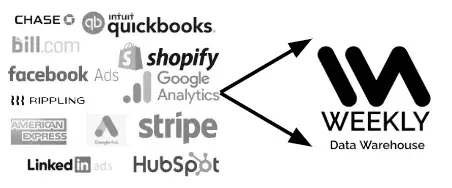
We seamlessly connect Quickbooks, Shopify, Google Analytics, Facebook, Stripe, Hubspot, Salesforce, Xero, Netsuite, Intacct, Athena, CollabMD, Simple Practice and many many more. If we don't have a connector, we'll build one.
We track key metrics including:
We serve businesses across various stages, from startups to established companies, with particular expertise in DTC brands, marketing agencies, e-commerce, SaaS, and small to medium-sized businesses.