Enter Your Email Below to Get Your Free CFO Analysis, Your EBook on seeing business, life and reality better, and an Integrated Financial Model.

Hi, I am John, after getting my Harvard MBA, I grew six businesses as the CFO to over $100 million in revenue. One of the businesses was Assembled Brands, a debt financier to emerging brands, where I looked at thousands of financial models seeking investment. I saw how broken these financial models were. So, I built my own… A novel Integrated Financial Model that I AM GIVING OUT TO YOU FOR FREE, along with an initial FREE CFO ANALYSIS of your business.
While founding these businesses, I constantly wrote my life and Founder/CFO lessons. These writings evolved into poetry, then a whole book “Zen and the Art of [nothing].” A poetic story on the Metaphysics of Quality to inspire and empower the entrepreneur in each of us to create something from nothing…
And, I want to give all three of these to you as a GIFT, FOR FREE.
Using the Integrated Financial Model, the CFO Analysis, and the Ebook you get the feeling that you have;
(1) all the immediate advantages of a first rate financial consultant and
(2) a resource to which you can refer over time…


Enter Your Email to Get Your Free CFO Analysis for Your Business;
Plus Two Bonuses:
Bonus 1) Free Ebook on Solving Financial Issues for Small Businesses
Bonus 2) Integrated Financial Model
Focus of The System
The System does what you expect a great CFO to do:
- Illuminate the Contribution Engine
- Analyze trends in Unit Economics, and
- Forecast Cash Flow and Profitability.
Don’t hire a CFO until you implement a CFO system.
Sadly, most CFOs don’t know how to implement systems.
01
How The System Works
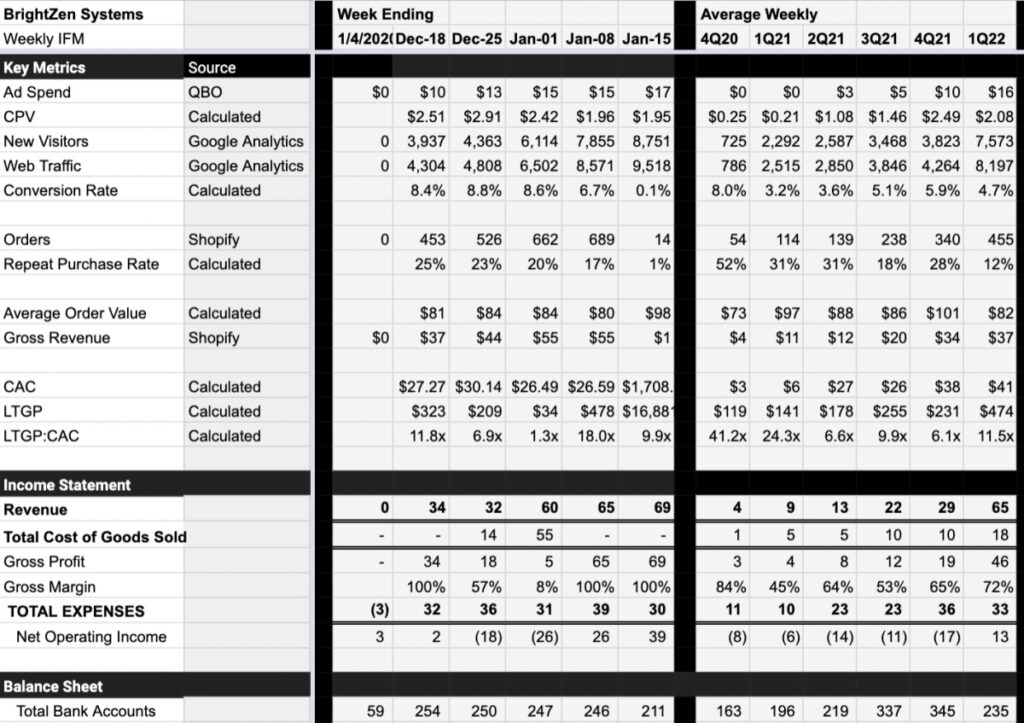
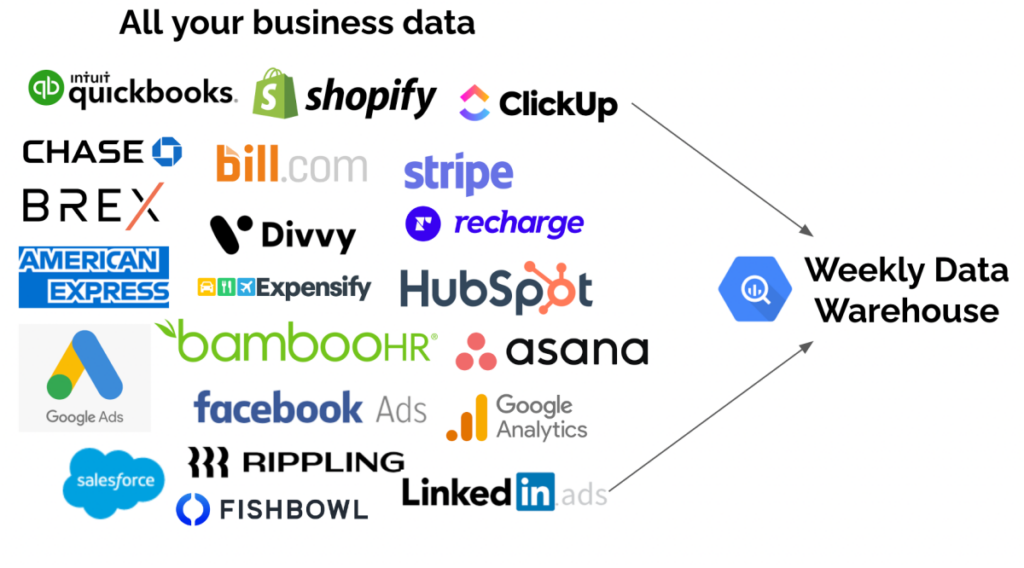
Your business has data spread out in a bunch of applications. Consider Weekly Accounting like the plumbing. We integrate data from every business application and present it in a simple set of views that highlight the trends in your unit economics and financials weekly, monthly and quarterly.
Most CFOs and bookkeepers work really hard to “close the books” monthly – just twelve times a year.
The Weekly Accounting System automatically presents this data weekly – 52 times per year.
With 52 iterations per year instead of 12, you and your team will improve faster.

02
Components of the System
The System has three main components:
- The Weekly Data Warehouse;
- The Integrated Financial Model; and
- Monday Morning Metrics.
Once you see your business weekly,
the old ways of seeing your business will seem quaint.
03
Illuminating the Contribution Engine
The Contribution Engine of a business is how it reaches and sells to customers and then how it gets paid for and delivers a result.
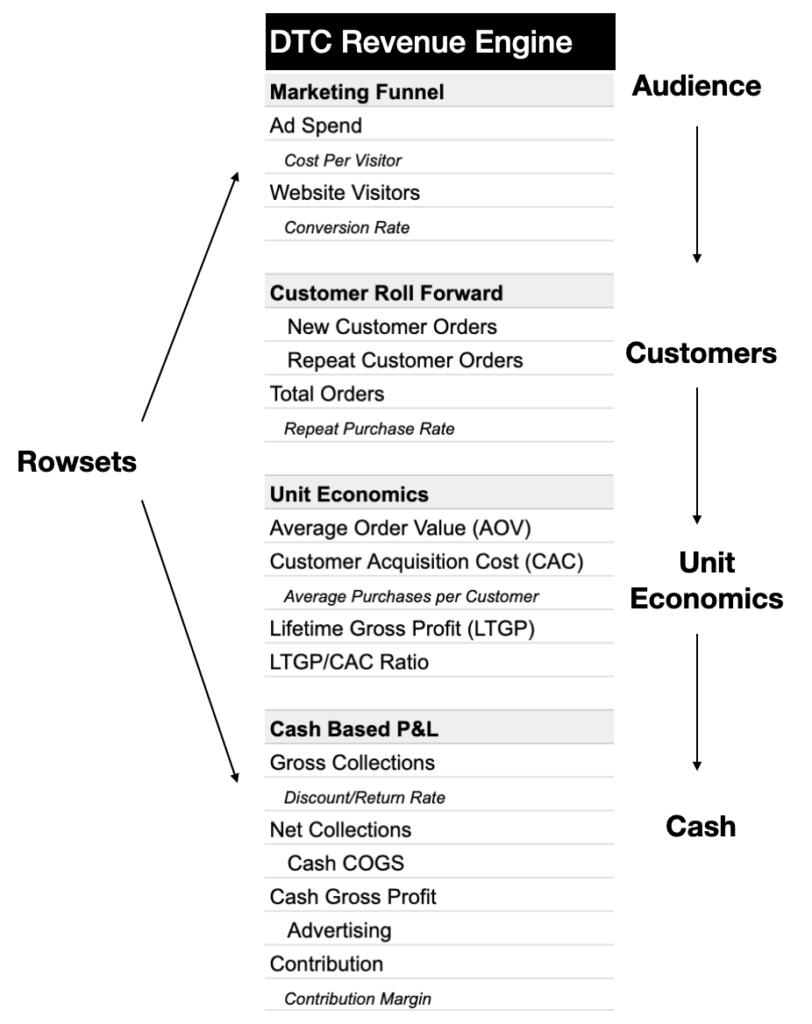
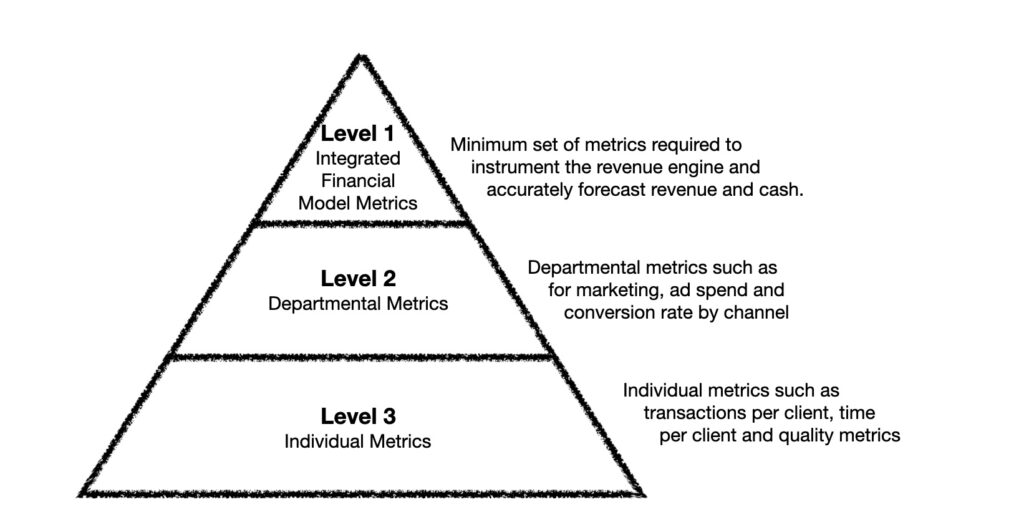
The Contribution Engine Rowset is like the dashboard on a car – a set of numbers that indicate the performance of the engine and the car on the road. When we “instrument” a Contribution Engine we are focused on the information necessary for calculating the unit economics.
Your Contribution Engine, consists of:
- Your Audience – How big is your potential market? How do you reach them?
- Your Marketing and Sales Funnel – How do you convert your audience into customers?
- Your Customer Engagement – How many new, active and repeat customers do you have?
- Your Revenue & Collections – How do you make money? Are you pricing properly?
- Your Cost of of Revenue – How much does it cost to satisfy your customers?
- Your Contribution – How much do I make after servicing customers and my sales and marketing activities?
04
Example Contribution Engine: An eCommerce Business
Because it’s generally intuitive to people, and has simple jargon, let’s consider the Contribution Engine of an eCommerce or Direct to Consumer (DTC) business, first in words, then in a ROWSET.
Direct to consumer businesses spend money to drive visitors to a website where the visitors view products in a catalog and buy them online.
And now the ROWSET:
05
Analyzing Unit Economics
Unit Economics is your business expressed on a per unit basis. A “unit” could be a single product, a customer, a subscription, or any other quantifiable item that generates revenue.
The five components of unit economics are:
- Revenue Per Unit: This is how much money you earn from selling one unit of your product or service. For example, if you’re selling coffee, how much do you make from one cup of coffee?
- Cost Per Unit: This includes all the costs directly related to producing or delivering that unit. For the coffee example, this would be the cost of beans, water, cup, labor, etc., for one cup.
- Profit Per Unit: This is calculated by subtracting the Cost Per Unit from the Revenue Per Unit. It tells you how much you earn (or lose) for every unit sold. When it’s expressed as a percentage of revenue it’s called gross margin.
- Lifetime Gross Profit (LTGP): This is calculated by multiplying the Profit Per Unit by the average number of repeat purchases customers make. This works whether it’s a subscription business or a product business – more on that later.
- Customer Acquisition Cost (CAC): How much it costs to acquire a new customer.
Your business will live and die by the quality of your Unit Economics.
The Weekly Accounting system will help you see trends in your Unit Economics weekly.
If you aren’t managing your business weekly, you are managing your business weakly
06
Forecasting Profitability and Cash Flow
We’ll help you understand your cash runway and the financing options that might be available to you – from credit cards, to SBA loans to SAFE notes, and equity capital.
Over the last twenty years the Weekly Accounting System has helped founders raise hundreds of millions of dollars of capital and created billions of dollars in value for the businesses that have adopted it.
We know it sounds like a lot, but we’re able to do this so inexpensively because, as business systems engineers, we designed the Weekly Account System to do it automatically.
07
The Weekly Data Warehouse
The Weekly Data Warehouse is a well architected, customized, automated centralized place that holds all your business data.
Securely stored in the Google Cloud.
Traditional accountants focus only on your bank data. That is like listening to music and only hearing one note.
08
The Integrated Financial Model
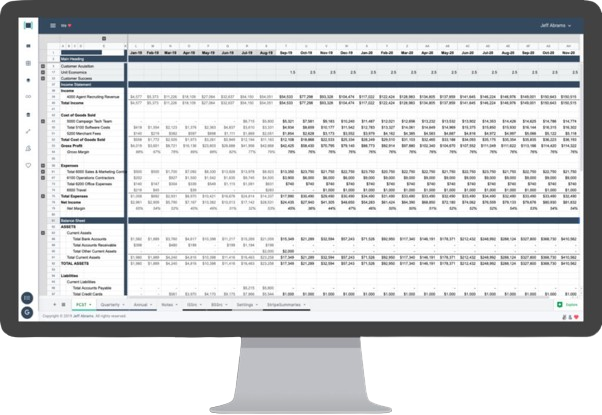
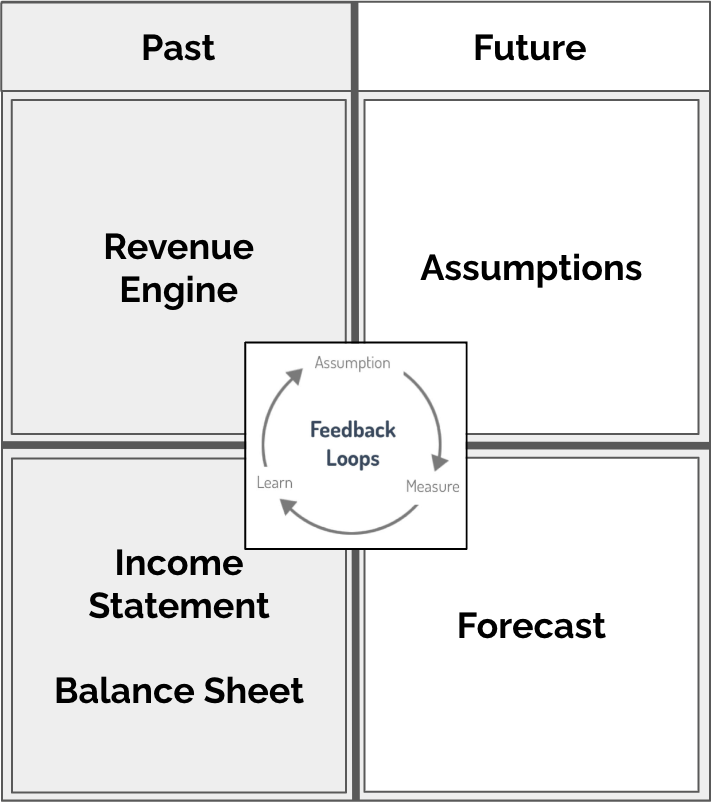
All the data from the Weekly Data Warehouse is Integrated in a custom financial model build based on the applications you use to run your business.
This eliminates manual data entry and lets you focus on scenario analysis and strategic decision making.
09
Monday Morning Metrics
Monday Morning Metrics is a weekly view of all your business data. With weekly metrics, you’ll get to see what’s happening in your business 52 times per year instead of 12. Accountants don’t normally think weekly because they wait for bank statements to close the books.
When you do bookkeeping with Weekly Accounting, we make sure your bank balance matches your book balance every single week.
We also roll up all data from all your systems and present them to you in a weekly view.
Every week we can see how you are doing against your average weekly historical numbers.
Its hard to imagine that anyone compares months. March for example, is 10.7% longer than February when its not a leap year. What’s more is most business are different on Sundays than Tuesdays. Churches do better on Sunday’s, Chik-fil-A does better on Tuesdays. 😉
